
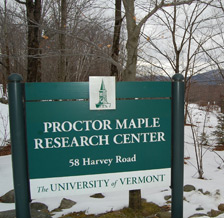
UVM Proctor Page
Syrup yields not equal across all operation sizes
Bigger operations tend to have better yield averages
By MARK ISSELHARDT, UNIVERSITY OF VERMONT EXTENSION MAPLE SPECIALIST/MAPLE PROGRAM LEADER | OCTOBER 2, 2024

MORRISVILLE, Vt.—The USDA Census of Agriculture was published last winter. Many interesting trends were seen in the data.
Maple production numbers in the 2022 Census tally saw the total number of U.S. taps rise to 17,970,611; a 21% jump from the 2017 Census of 14,864,604.
The largest gains in taps were found in the largest sized operations (>10,000 taps) which saw 2.6 million new taps compared to 2017.
This significant growth was contrasted by little apparent change in the total number of maple operations between 2017-2022.
In 2017 there were a total of 9,462 operations reporting maple production.
This number grew by 104 (1%) over the 2017-2022 timeframe.
The yield of syrup (gallons of syrup/tap) is a metric that producers will use when deciding on whether to make investments in sap collection technology.
It is well documented that producers who rely on gravity sap collection practices will on average produce less sap than those who invest in vacuum collection technology.
How that technology is adopted, operated and maintained can vary greatly, meaning that just because a producer chooses to change from buckets to vacuum doesn’t mean that production will always be greater.
The scale of a given operation also impacts the ability to maintain high sap yields.
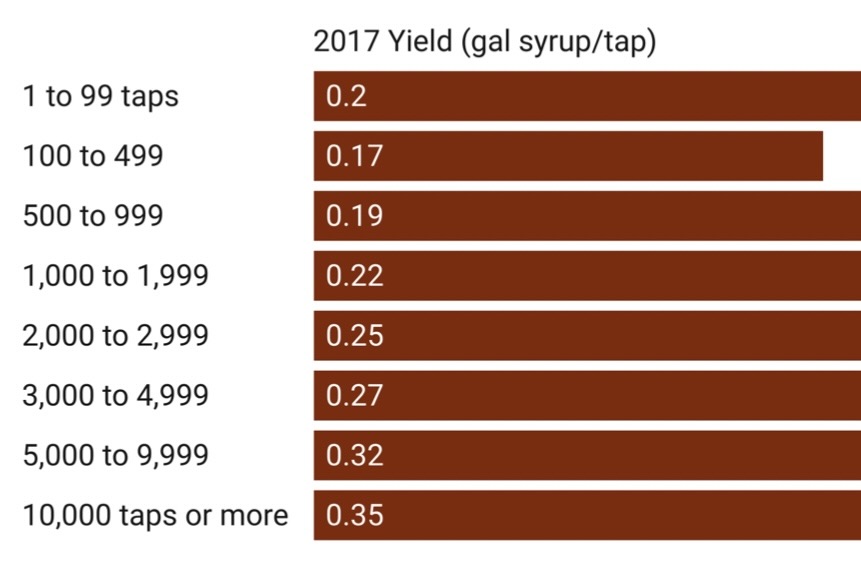
Generally, the data suggests that the larger maple operations will realize higher average yields than operations with fewer taps.
This pattern appears to be consistent between 2017 and 2022. The one size operation that consistently bucks this trend is the 1 to 99 tap class.
This could reflect the fact that above more than a handful of taps, the logistics of maintenance, collection, transport and boiling of sap can become significant.
The fact that the largest size operations appear to enjoy the highest yields could be a reflection of higher investment in collection technology (labor, tubing, vacuum, wireless monitoring, etc.).
Perhaps noteworthy in this data is the fact that between 2017 and 2022, syrup yield increased by 7% across all operation sizes but that some sizes saw lower grains, but the patterns did not appear to follow a predictable trend.
For example, 1 to 99 tap operations gained ~4% in yield and 3,000 to 4,999 and >10k tap operations increased yield by 3%.
Whereas 500-999 tap and 5,000-9,999 tap operations saw a 10% increase in yields between 2017-2022.
In 2017, operations with more than 5,000 taps had an average yield of 0.33 gallons of syrup/tap.
This compared to operations with < 5,000 taps that saw average yields of 0.22 gallons of syrup/tap.
The differences were similar in 2022 when operations with < 5,000 taps saw average yields of 0.23 gallons of syrup/tap and those with > 5,000 taps saw 0.36 gallons of syrup/tap.


Fall
Sale!
© 2026 The Maple News