Cornell Corner
Update on Cornell tests on 3/16” maple tubing
Program conducts three demonstration sites using 3/16” maple tubing
By BY STEPHEN CHILDS NYS MAPLE SPECIALIST |
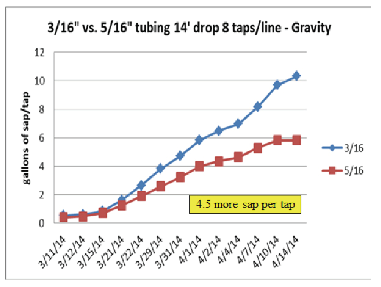
During the 2014 maple season the Cornell Maple Program conducted three demonstration sites using 3/16” maple tubing. Each demonstration site was set up in the month of February and tapped the last week of February. The first sap run occurred on March 10th. The demonstrations were set up to compare sap yield from a new 5/16” lateral line with 8 taps using 5/16” standard black check valve spouts on new 5/16” drop lines with sap yield from a new 3/16” lateral line with 8 taps using 5/16” standard black check valve spouts on a new 5/16” drop lines for 8 inches then fitted to 3/16” drop line.
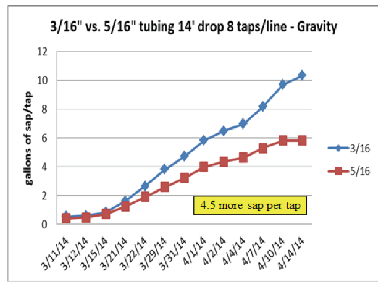
Eight trees were tapped in each demonstration with the two treatments tapped in the same tree, about 7 inches apart, in the same basic orientation. The first demonstration had 14’ of drop from the highest tap on the highest tree to the top of the collection tank. Sap yield was collected following each run starting on March 11th. The graph below shows the sap yield difference between the 5/16” lateral line and 3/16” lateral line each with 8 taps in gallons of sap per tap. The 3/16” lateral line yielded 10.3 gallons of sap per tap over the season and the 5/15” lateral line yielded 5.8 gallons of sap per tap or an increase of 4.5 gallons of sap per tap.
The second demonstration was set up exactly like the first except with 17 feet of drop from the spouts on the highest tree to the top of the collection tank. The graph below illustrates the results of this demonstration and showing a very similar increase of 4.5 gallons of sap per tap.
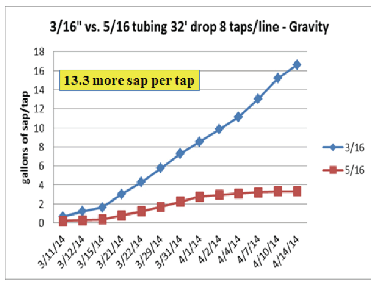
The third demonstration was again the same set up as the first and second except with 32 feet of drop.
In this case the vacuum created by the 3/16” lateral line appears to have stolen sap from the spouts hooked to the 5/16” line with the 3/16” line yielding 16.6 gallons of sap per tap while the 5/16” lateral line yielded just 3.3 gallons of sap per tap for a difference of 13.3 gallons of sap per tap more in the 3/16”.
Results from this kind of demonstration create many new questions such as how many taps are needed on a 3/16” line to result in good vacuum and how many taps can a 3/16” line support. This demonstration demonstrates that 8 taps is sufficient to generate significant vacuum though vacuum tests were not included in this demonstration. It was simply a yield comparison. Testing the number of taps necessary to generate excellent vacuum will need to be conducted during the maple season as testing that with a simulated set up would generate many more questions.
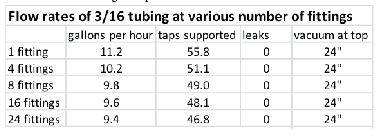
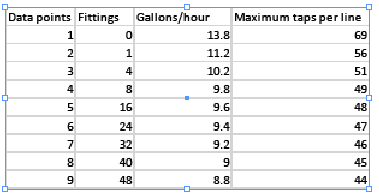
To try to answer the question of how many taps can a 3/16” line support, a series of experiments were conducted in the summer of 2014. A site was located where we had easy access to the top of the elevation and a drop of 35’ was measureable. Water was transported to the site in 15 gallons jugs. 270’ of 3/16” maple tubing was laid on the ground to obtain the drop of 35’ on about a 13% slope. The line siphoned water from the jugs to establish the volume of water that could be conducted through the 3/16” lines over time. A vacuum gauge was plumbed in at the top of the line to measure vacuum pull on the line. Fittings were added to the line in increments to assess how adding T’s would influence the flow level. The flow rate of .2 gallons of sap per hours per tap is used to estimate how many taps the 3/16” tubing could support. The first chart below indicates just how many fittings were in the line, followed by how much water was siphoned through the line per hour, followed by the number of taps the 3/16” line could support if taps were contributing .2 gallons of sap per hour. The next column lists the number of leaks in the line and the vacuum measured at the top. The number of taps that the calculations say can be supported is much larger than I would have anticipated ranging between 47 where 24 fittings were in the line to 56 where only a fitting for the vacuum gauge was in the line.
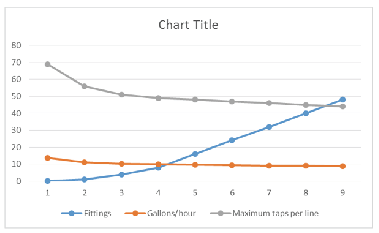
By graphing this data we can estimate what the flow rate would be when putting more fittings and taps on the line. The graph below would estimate that a maximum number of fitting and taps comes together at about 45 taps per line. This would suggest that if you had excellent flow conditions the line could support up to 45 taps before resistance in the line would cause the vacuum to drop in the tubing system. It is important to note that this is with 35” of drop on a 13% slope. The chart will change with either a change in drop or a change in slope and should only be used as an example.
It is important to recognize that it is not necessary to have many taps on the 3/16” line to develop the vacuum. In these tests 8 taps per line generated excellent vacuum. I’m not suggesting producers consider going to such high numbers but it is interesting that it appears the line can support them. From a line maintenance perspective it is a significant benefit to have shorter lines when seeking to find and fix leaks. The 3/16” tubing systems need to be kept leak free if they are to yield the added benefit.
The remaining factor that was tested in 2014 was the influence of leaks in a 3/16” tubing system. To look at this, leaks were created in the line as it was siphoning water from the jug at the top by drilling several 1/16” holes in the line. The first hole was drilled 20’ of elevation below the tank, the second hole 10’ below and the third hole 5’ below the elevation of the water tank. The leaks both reduced flow rate and significantly reduced vacuum at the top. As suspected leaks will significantly reduce the vacuum advantage provided by the 3/16” tubing. A 1/16” hole is very small compared to the average squire damage typically seen in maple tubing systems.
In the fall of 2014 two demonstration plots were set up. One with 47’ of drop and one with 34’ of drop. Vacuum gauges were installed on every other tap to observe the influence of location in the line on the level of vacuum at the tap. The line with 47’ of drop consistently showed 27” of vacuum on the top tap with declining vacuum at each gauge depending on the elevation drop below that tap. The bottom tap, right next to the end of the line showed 0” vacuum. With the 34’ of drop the top tap showed 24” of vacuum. These reading were consistent even when the sap was frozen and when there had been no freeze of several days.
During the 2015 maple sap season the Cornell Maple Program conducted a small trial of sap yield from 5/16” tubing vs. 3/16” tubing. This trial was not conducted at the Arnot Research forest but with a small maple operation cooperator. The tubing system consisted of six lateral lines, three 5/16” and three 3/16” alternating between the two treatments across the hill side. The lines were set up on a previously untapped forest with a north facing slope with tapped trees ranging from 10” to 19” in diameter. Each line had between 8 and 11 taps per line and averaged about 220 feet in length. The slope of the woods was very consistent with a drop of about 23’ from the tops of the lines to the collection tanks. The three 3/16” lines had a total of 32 taps and the 5/16” lines had a total of 26 taps. The spouts were all new black 5/16” plastic with 3/16” fittings for the 3/16” tubing and 5/16” fittings for the 5/16” tubing. Trees were tapped on March 11, 2015 in deep snow. The total yield per tap with the 5/16” was 11.25 gallons of sap per tap and the yield from the 3/16” tubing was 18.2 gallons of sap per tap. There was one problem with the collection tanks used as on several occasions the tanks collecting from the 3/16” were running over when the cooperators arrived to collect the sap. The 5/16” tanks did not have this problem. Sap collection was finished on April 9th. The installation time for setting up the 3/16” lines verses the 5/16” lines was identical. The yield difference between the 3/16” setup and the 5/16” set up is at least 6.95 more gallons of sap per tap or an increase of 62%. That would represent a little more than an increase of one pint of syrup per tap or a total increase of four gallons of syrup from the 32 taps. A special thanks to Bob Beil, Gordon Putman, Dave Norton and the Upper Hudson Maple Producers for their support for this study.
June/July 2015

